Firstly, before I hit the miserable stuff, thank you so much to my Patrons—all 1465 of you (plus those who have been bumped off by Patreon’s troublesome payments system, but I digress). For over four years now, you have enabled me to work full-time as an independent scholar. Without your support, I’d be at best a part-time researcher, with either the infuriating administrative overhead of a university position getting in the way, or with the worries of a retired person trying to do something meaningful, while surviving on a pension.
When I was a university academic, I used to joke that I couldn’t wait till I could retire, so that I could get some serious work done. You have made that joke a reality, and I couldn’t be more grateful. I sometimes get daunted by the amount of work I am doing, and the seemingly endless demands on my time. But it’s what I want to do, and it’s no-one’s fault that there are only 24 hours in a day. The fight against the insanity of Neoclassical economics is more important now than it ever was, as is the construction of a realistic, alternative economics, and you enable me to be a full-time warrior in both those battles. So once again, thank you.
Now let’s start with the positive aspects of the approaching year. But if you’d rather just check out the “Hold My Beer” parts of my expectations for the next year, click here.
Looking Forward—Politics
Next year promises to be my biggest battle of all: as many of you know, I am standing as a candidate in the next Australian elections for a new party, The New Liberals.
For non-Australians, the ruling Liberal-National Coalition is a right-wing party, similar to the USA’s Republicans and the UK’s Tories. Consequently, the word “Liberal” in Australia connotes “conservative”—the opposite of its meaning in the USA and UK, and most of the rest of the world.
The New Liberals hope to appeal to so-called “small-l” Liberals who are appalled by the Coalition’s drift to the right over the last 40 years. In particular, they want to unseat the COALition J, and enable the opposition Labor Party to form government. They are running in Coalition-held seats only, and aim to draw votes away from Coalition to help defeat Coalition politicians.
In office, and assuming a Labor Party victory, we hope to pressure the Labor Party government to (a) introduce an ICAC—”Independent Commission Against Corruption” which will be stronger than the one the Labor Party has proposed; (b) accept deficit spending as a necessary aspect of a well-functioning fiat money system; (c) undertake significant action on climate change, rather than the wishy-washy proposals Labor has made to date; (d) end refugee detention; and (e) a whole range of progressive social and economic policies. To be effective, we need to hold the balance of power in the Senate, and the party’s founder, Victor Kline, was initially standing for the Senate in NSW.
I took Victor’s place on the Party’s ticket in a roundabout way. I had first agreed to be an economic advisor after Victor approached me. He had a firm grasp of Modern Monetary Theory, and had also read Debunking Economics, so he was aware that the Neoliberal policies that dominates mainstream political parties across the world were based on nonsense analysis. That alone impressed me. Then I undertook due diligence on him by reading his autobiography (The House on Anzac Parade), and I was sold: he was a person of principle, who was disgusted by the state of politics in Australia, and wanted to do something about it.
Though Victor was originally running as a candidate for the Senate (Australia’s Upper House, which has a proportional voting system which makes it feasible to win a seat with as little as 14% of the vote), as with the US system, the real power resides in the House of Representatives. With the party’s rising profile on social media, Victor decided to take a punt at winning North Sydney, the seat in which he lives, which is currently held by a “progressive” Liberal Party member, Trent Zimmerman. Despite Zimmerman’s progressive personal credentials, he has never “crossed the floor” on any issue, so his voting pattern is 100% conservative.
Victor’s decision left the top Senate position vacant, and he asked me to fill it.
I thought, why not? I’ve had limited success in raising awareness about bad economics and the dangers of climate change because I can’t get the ear of politicians: why not see what happens if I can get the mouth of one instead?
So, what are my odds of success? Better than zero, given the Australian electoral system.
For starters, there are 6 successful candidates for every Senate election in Australia: it’s a “State’s House”, and every State has 12 Senators, each of whom serves two terms. Voting is proportional, so a “Quota” is effectively 14.5% of the total vote (1/7th of the total vote plus 1).
Secondly, unlike the American system, voting in Australia is compulsory. I imagine that some might see that as an affront to “freedom!”. To me, it’s a way to stop politicians ignoring segments of the electorate because they either don’t vote, or can be discouraged from voting—or even prevented from doing so. Not so in Australia: politicians have to pay at least lip service to every segment of society, because every segment can and will vote. To me, this is a necessary constraint on the behavior of politicians, not an assault on individual freedom.
Thirdly, also unlike the US system, voting is “preferential”. Rather than simply marking “Democrat” or “Republican” or “Green” or “Ralph Nader”, you have to rank the parties in order, and make at least six choices. If your first preference doesn’t get enough votes to score a Quota, then your second preference is checked. Voters must provide at least six preferences, so in effect your vote has six “bites at the cherry” before it can be either finally allocated, or discarded.
It’s even more complicated—and representative—than that, because if one of the major parties scores, say 2.4 Quotas, then its first two candidates are elected, while the superfluous 40% of a Quota is then distributed according to voter’s second, etc., preferences.
Given my profile in Australia, and the rising visibility of The New Liberals, it might be possible for me to get a significant first vote—say 5% of the vote. That is well short of a Quota, but then (a) 2nd and lower preferences from other candidates who get knocked out without achieving a Quota, and (b) 2nd and lower preferences from people who voted for the major parties—Labor and Liberal—but whose votes were excess to the 2 Quotas needed to elect two of their candidates to the Senate, might just get me over the line.
Wish me luck! And if you can afford it, once I’ve established a GoFundMe campaign to raise funds for my political campaign, please donate.
Looking Forward to 2022—Academic and Economic
I have almost finished writing the Modelling with Minsky book; I keep being waylaid from it by other work, and there are a couple of features we need to add to round out the program before I can finish the manual. But that will surely be finished and published for free download by early January. I’ll store it at http://www.profstevekeen.com/minsky/; there is already an early draft there for those who wish to learn how to drive Minsky, and undertake complex systems modelling in general.
I will start work—or rather recommence it—on the 3rd
and final edition of Debunking Economics, which will be published by Castalia House. This will reorganize and fill out the opening chapters somewhat (I’ll start with “the supply curve” rather than “the demand curve” as the 2nd edition does), drastically improve the chapters on money (I hadn’t invented Minsky before finishing the 2nd edition, and I’ve learnt so much about money courtesy of building Minsky that I need to do an almost total rewrite of that chapter); and add a substantial section on the travesty of Neoclassical “climate change” economics. I hope to finish the book by the end of the year.
I will also continue working on the economics of climate change with my team of co-authors. We plan 3 new papers: one on tipping points, in response to the delusional nonsense in Dietz et al.(Dietz, Rising et al. 2021); one working backwards from Dietz and two other ridiculous 2021 paper by economists (Kahn, Mohaddes et al. 2021, Warren, Hope et al. 2021); and one working forward from Nordhaus’s absurd “simplifying assumptions” to today.
We are also almost at the end of the refereeing process for our letter to PNAS critiquing the delusional paper on tipping points by Dietz and co. I hope to see that published early in 2022.
Plus, I’ll keep writing blog posts and occasional papers on monetary dynamics and complexity, developing Minsky—especially if we can secure funding from somewhere to continue its development (suggestions appreciated!), and in general working my typical 12 hour day, 7 days a week. There is no time to lose: I’ll relax after I’ve died.
Which brings me to why I think we’ll come to regard 2020 as the “Hold My Beer” decade, if ever we get to enjoy the luxury of hindsight.
The 2020s: the “Hold My Beer” Decade
When David Graeber died, probably of complications from Covid (we’ll never know, but that’s the opinion that both I and David’s widow Nika Dubrovsky have come to), I wrote that maybe the cliché and optical measure of “20-20 vision” was a warning from a time-traveler about what the year 2020 was going to bring.
Then along came 2021. I didn’t lose any more close friends, so that at least is a bonus over 2020, but what a pig of a year it was—and what a shitty ending it is having as well.
With the exception of the tragedy of losing David in 2020, personally I had a reasonable enough year. I lost my mother, but that was at the age of 94, after she had lived a great and well-loved life. And I moved to Thailand with my Thai wife Nisa, and that was wildly successful at avoiding Covid—the whole country had less than 5,000 cases in total up until mid-December 2020.
Then all hell broke loose. The Thais let their guard down, once in December with a Covid outbreak amongst migrant workers, secondly in a high-class nightclub in March. In mid-2021 Delta emerged, and hit the whole globe with another large wave, thanks to its higher transmissibility. Now we have the omicron variant, which appears to be the most contagious human disease since measles.
Covid in general played havoc with global supply chains. Inflation began courtesy of both the supply chain disruptions and the huge increase in household deposits thanks to the government deficit spending that, however poorly, got the market economy through the first two major waves of Covid.
Climatic disasters, which had begun with unprecedented fires in Australia in 2019, were followed by unprecedented fires in the western USA and southern Canada, the unprecedented flooding in the USA and Europe, followed by unprecedented….
We’re going to see a lot of that word this decade. We are relieved to see each year disappear down the calendar’s gurgler, only to find that the one that follows it is even worse. Who could ever have predicted this, eh?
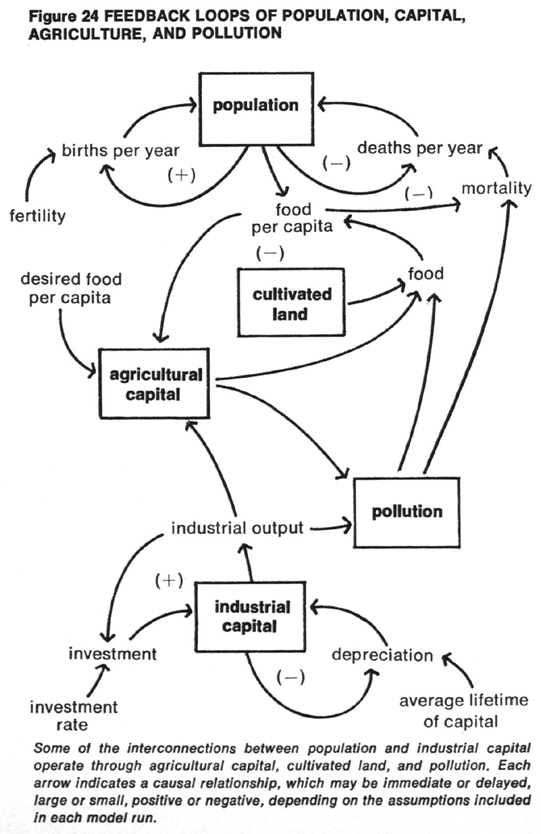
The answer to that question is, of course, the authors of The Limits to Growth (Meadows, Randers et al. 1972). Using a sophisticated system dynamics model, which had been calibrated to reproduce the trends between 1900 and 1970 in five fundamental system stress—population, capital, food, nonrenewable resources, and pollution—and then run forward in time in a model that attempted to capture all the major feedback effects between these five variables, they foresaw a serious prospect of overshoot and collapse in the early to mid-21st century.
Figure 1: An example of the feedback loops in the Limits to Growth system dynamics model
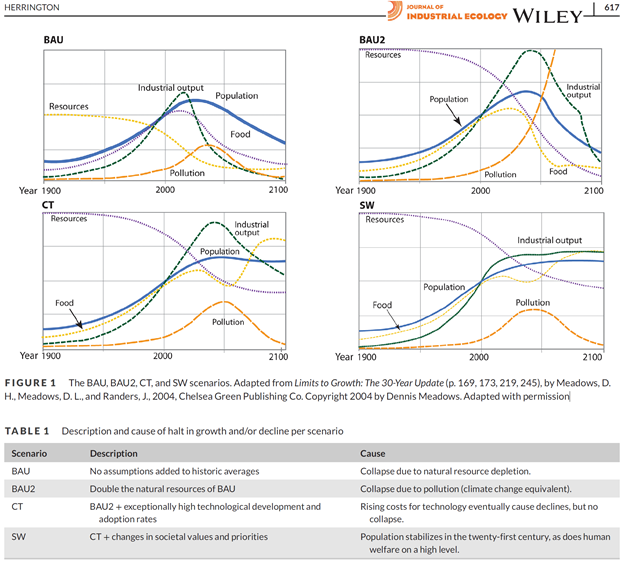
This model was ridiculed out of contention in economics, by economists who don’t have a clue about either climate or system dynamics modelling (Forrester, Gilbert et al. 1974). This was a tragic error, because as aggregated and stylized as the model was, its predictions for trends in those system states in its “Business as Usual” model have largely matched the subsequent 50 years of economic and environmental data (Turner 2008, Turner 2014, Herrington 2021).
Figure 2: Key Limits to Growth graphs reproduced by Gaya Herrington “Update to limits to growth” (Herrington 2021)

The authors of The Limits To Growth were very careful to emphasize that they were not attempting to make precise predictions about the future:
The output graphs reproduced later in this book show values for world population, capital, and other variables on a time scale that begins in the year 1900 and continues until 2100. These graphs are not exact predictions of the values of the variables at any particular year in the future. They are indications of the system’s behavioral tendencies only. (Meadows, Randers et al. 1972, pp. 90-91)
That said, their main simulation runs showed Industrial output, population and food all peaking around about … 2020 to 2030. The “Hold My Beer” decade.
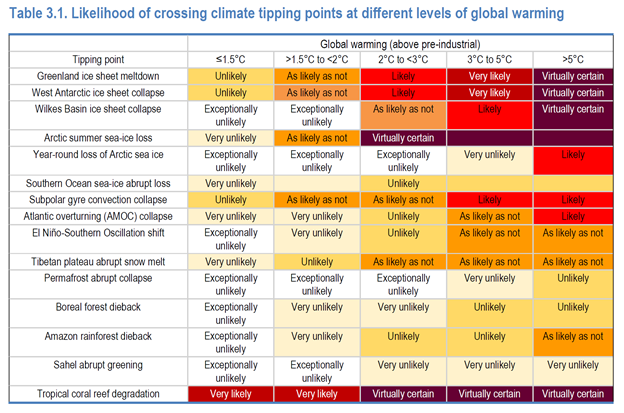
Scientific opinion on tipping points, and some modelling of tipping point processes, also implies that one major element of the Earth’s climate—the sea-ice in the Arctic during summer—could tip into an ice-free state at 1.5°C above pre-industrial temperatures (see Figure 3).
Figure 3: The OECD’s estimation of temperatures at which major tipping points will be triggered (OECD 2021, p. 121)

We are already at about 1.3°C above, and it could be that the crazy weather events we have already seen in the 2020s are to a substantial … degree (sorry!) caused by this. Paul Beckwith made the point that, when this happens, during summer there could be a dramatic shift in the coldest spot in the Arctic from the North Pole to Greenland—a 17° shift. This could cause incredible instability in the weather patterns of the Northern Hemisphere—which is what we are seeing right now.
The amplifying effect on global warming of losing the reflectivity of Arctic summer sea-ice is mind-boggling as well. One fact that I’m still wrapping my head around is that the amount of solar radiation energy that lands on the Arctic during summer exceeds that which hits the Equatorial band of the planet. The reason, fairly simply, is that while the angle of the sunlight at the North Pole is more oblique than at the Equator, the Arctic is in sunlight for 24 hours during summer, the Equator for less than 12.
Consequently, if the Arctic summer sea-ice disappears, the Arctic will go from reflecting 90% of this energy to absorbing 80% of it, and the effect will be equivalent to 40 years additional CO2 production: a trillion tonnes of CO2.
It may be that the ridiculous weather events we have started to experience since 2019 are a product of both the loss of the Arctic’s summer sea-ice, and the feedback effects outlined by the Limits to Growth all those years ago—50 years next year.
Eat, drink and be merry, for tomorrow…
I expect 2022 to be worse than 2021, which was worse than 2020… and so on till the end of this decade. So, what to do?
At least for the next week, I intend partying with my extended family, now that I’m back in Sydney for the first time in 21 months. We are eating outdoors (easy to do when it’s over 25°C), and we will be surrounded by fans to amplify the ventilation effect of the open air. I hope that you also get the chance to party with your family and friends too, though safely, given the contagiousness of omicron. If all else fails, there is still love for those closest to you, and that may be all we have to get us through this Hold My Beer decade.
References
Dietz, S., J. Rising, T. Stoerk and G. Wagner (2021). “Economic impacts of tipping points in the climate system.” Proceedings of the National Academy of Sciences
118(34): e2103081118.
Forrester, J. W., W. L. Gilbert and J. M. Nathaniel (1974). “The Debate on “World Dynamics”: A Response to Nordhaus.” Policy Sciences
5(2): 169-190.
Herrington, G. (2021). “Update to limits to growth: Comparing the World3 model with empirical data.” Journal of Industrial Ecology
25(3): 614-626.
Kahn, M. E., K. Mohaddes, R. N. C. Ng, M. H. Pesaran, M. Raissi and J.-C. Yang (2021). “Long-term macroeconomic effects of climate change: A cross-country analysis.” Energy Economics: 105624.
Meadows, D. H., J. Randers and D. Meadows (1972). The limits to growth. New York, Signet.
OECD (2021). Managing Climate Risks, Facing up to Losses and Damages.
Turner, G. M. (2008). “A comparison of The Limits to Growth with 30 years of reality.” Global Environmental Change
18(3): 397-411.
Turner, G. M. (2014). Is Global Collapse Imminent? An Updated Comparison of The Limits to Growth with Historical Data. Melbourne, Melbourne Sustainable Society Institute.
Warren, R., C. Hope, D. E. H. J. Gernaat, D. P. Van Vuuren and K. Jenkins (2021). “Global and regional aggregate damages associated with global warming of 1.5 to 4 °C above pre-industrial levels.” Climatic Change
168(3): 24.